EPA set PFAS MCLs at 4 ppt in 2024. Most existing treatment trains were not designed for it. GAC, ion exchange, NF, RO: costs, removal rates, and the compliance decisions that matter.
PFAS removal has become the defining compliance challenge for industrial water managers in 2024 and 2025. The U.S. EPA finalized maximum contaminant levels of 4 parts per trillion (ppt) for both PFOA and PFOS, a threshold so low it is orders of magnitude below what most existing treatment trains were designed to handle. A facility running an unmodified [industrial water filtration](/industrial-water-filtration) system that was specified even five years ago is almost certainly out of compliance today, and the cost of a regulatory enforcement action, including remediation orders, fines, and reputational exposure, runs from $500,000 to well over $10 million depending on jurisdiction and scale.
The uncomfortable reality is that most vendors will tell you their technology can handle PFAS. What they will not volunteer is the difference between "detectable reduction" and "regulatory compliance," or the fact that short-chain PFAS compounds behave fundamentally differently from the long-chain PFOA and PFOS that earlier guidance was built around. Vendors will recommend whatever they sell. The buyer's job is to model the lifecycle cost of the alternatives against a fully characterised contaminant profile, not a headline removal percentage.
This guide covers the four primary PFAS removal technologies (granular activated carbon, ion exchange resin, nanofiltration, and reverse osmosis), the emerging destruction route via advanced oxidation and electrochemical processes, how to select between them using threshold-based decision criteria, what CAPEX and OPEX actually look like when concentrate management is included, the failure modes that blow up compliance programs, and what the right procurement sequence looks like for an industrial site facing a 2024-era MCL.
## Quick Navigation
- [What PFAS are and why they resist conventional treatment](#what-pfas-are-and-why-they-resist-conventional-treatment) - [The four primary PFAS removal technologies](#the-four-primary-pfas-removal-technologies) - [Granular activated carbon: the entry-point technology](#granular-activated-carbon-the-entry-point-technology) - [Ion exchange resin: the compliance-grade solution](#ion-exchange-resin-the-compliance-grade-solution) - [Nanofiltration and reverse osmosis for PFAS removal](#nanofiltration-and-reverse-osmosis-for-pfas-removal) - [Advanced oxidation and destruction technologies](#advanced-oxidation-and-destruction-technologies) - [CAPEX and OPEX: what PFAS removal actually costs](#capex-and-opex-what-pfas-removal-actually-costs) - [Concentrate management: the cost nobody quotes you](#concentrate-management-the-cost-nobody-quotes-you) - [Where PFAS compliance programs fail](#where-pfas-compliance-programs-fail) - [Technology selection framework: matching the right treatment to your site](#technology-selection-framework-matching-the-right-treatment-to-your-site) - [The CFO Hook](#the-cfo-hook) - [Related Articles](#related-articles) - [FAQ](#faq)
## What PFAS are and why they resist conventional treatment
PFAS (per- and polyfluoroalkyl substances) are a family of more than 12,000 synthetic compounds defined by the carbon-fluorine bond, one of the strongest bonds in organic chemistry. That bond is what makes PFAS functionally useful, non-stick coatings, firefighting foam, food packaging, and industrial lubricants all exploit it, and it is exactly what makes PFAS so resistant to degradation in the environment and in conventional water treatment.
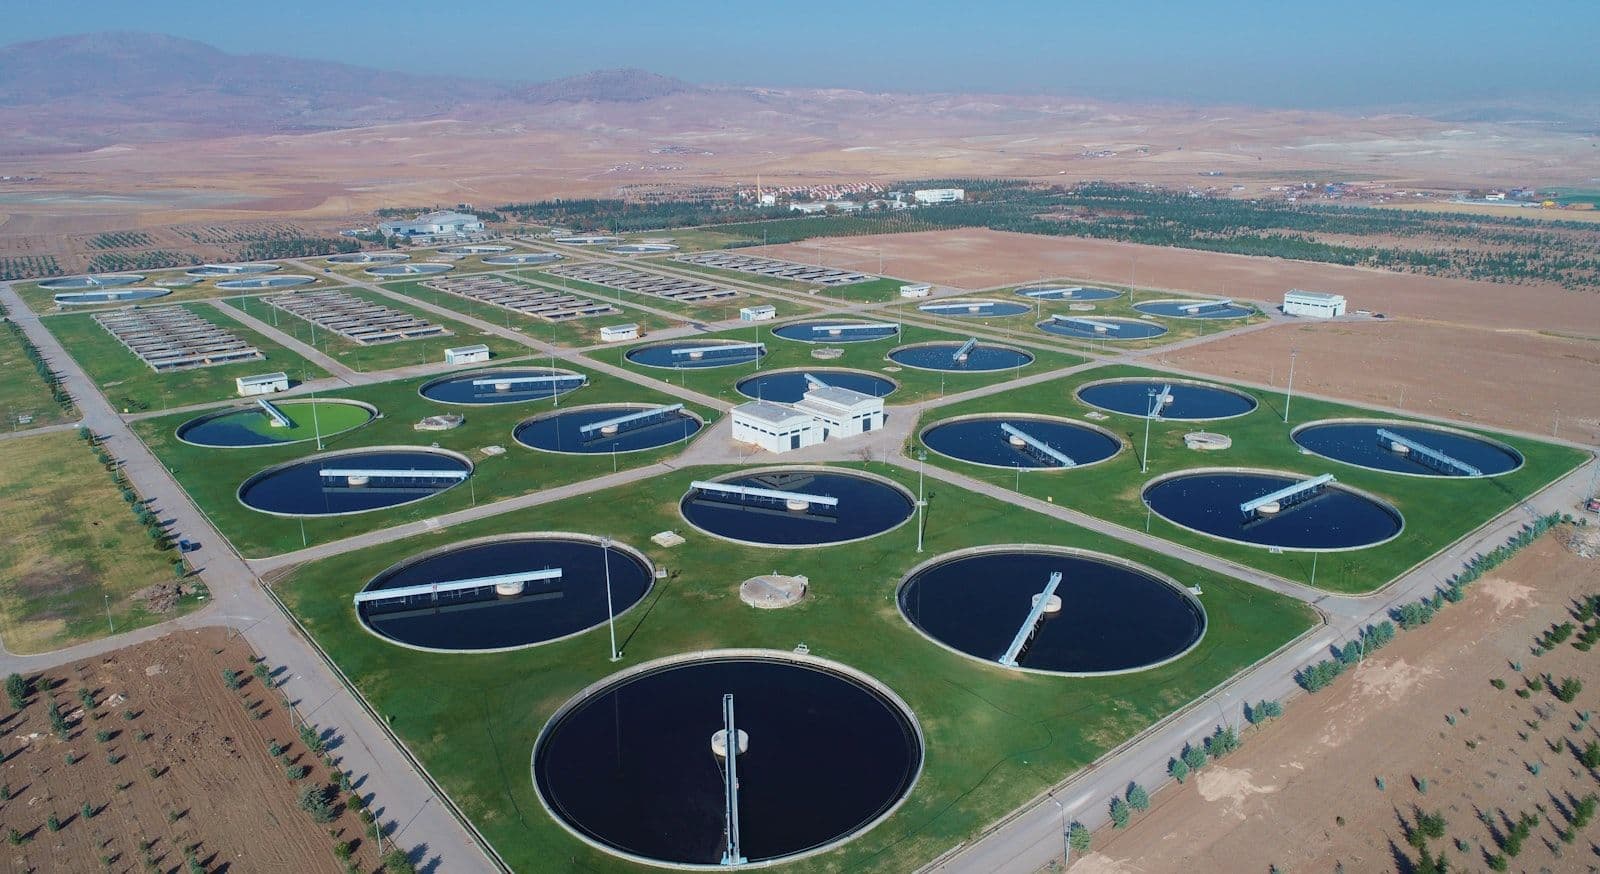
Standard [industrial wastewater treatment](/industrial-wastewater-treatment) processes, coagulation, flocculation, biological treatment, standard granular filtration, are largely ineffective against PFAS. The compounds are hydrophilic enough to pass through physical barriers but hydrophobic enough to bind to solids and sediments, meaning they move unpredictably through a treatment train that was not designed for them. The [U.S. EPA's 2024 PFAS National Primary Drinking Water Regulation](dofollow:https://www.epa.gov/sdwa/and-polyfluoroalkyl-substances-pfas) set MCLs of 4 ppt for PFOA and PFOS, 10 ppt for PFNA, PFHxS, and HFPO-DA (GenX), and a hazard-index limit for mixtures. These are not theoretical targets. They are enforceable limits with a compliance deadline of 2029 for large water systems.
Effective PFAS removal requires either concentrating the contaminants onto a sorbent (activated carbon or ion exchange resin), physically separating them through a tight membrane, or chemically destroying the C-F bond itself. Each route has fundamentally different cost drivers, concentrate implications, and performance ceilings, and no single technology fits every site.
## The four primary PFAS removal technologies
The technology landscape for PFAS removal consolidates into four practical routes for industrial and municipal applications. All four have demonstrated regulatory-grade performance under the right conditions. All four also have failure modes that vendors rarely lead with.
The comparison table in this guide (further below) puts the trade-offs on one page. The sections that follow explain the mechanism, the operating envelope, and the cost drivers behind each row so that a procurement or engineering team can evaluate vendor proposals against real benchmarks rather than marketing claims. Not sure which technology fits your site? [Browse verified industrial water treatment providers](/industrial-water-treatment-companies), filter by PFAS technology specialty, and request scoped proposals from three to five specialists.
The critical pre-selection step is a full PFAS screen using EPA Method 533 or 537.1. Without it, you are specifying technology against an unknown contaminant profile, which is how facilities end up with a GAC system that handles PFOA but passes GenX straight through to the effluent.
## Granular activated carbon: the entry-point technology
Granular activated carbon (GAC) is the most widely deployed first-line response to PFAS contamination, largely because it uses familiar infrastructure and is the lowest-CAPEX entry point. For long-chain PFAS compounds (carbon chain length C8 and above, including PFOA and PFOS), GAC achieves 70 to 90% removal at typical municipal and light-industrial loadings. That removal rate is adequate for some permit limits but will not reliably deliver sub-4-ppt effluent at sites with feed concentrations above 200 ppt.
The mechanism is adsorption: PFAS molecules bind to the high surface area of activated carbon, which can range from 800 to 1,200 m2 per gram. The binding is competitive. When the carbon becomes saturated, PFAS breakthroughs occur, and the effluent concentration can spike rapidly. The operating risk is not slow degradation but sudden failure. A plant running GAC beds without continuous effluent monitoring may be out of compliance for weeks before a scheduled lab test catches it.
Short-chain PFAS (C4 to C6, including PFBS, PFHxS, and GenX) are poorly adsorbed by GAC. A facility whose PFAS profile is dominated by short-chain compounds will see carbon exhaustion several times faster than expected, and the effluent guarantee collapses. Across projects in the aerospace and fire-training sectors, a pattern recurs: sites that assumed their PFAS profile matched the old C8-dominated datasets found their GAC beds exhausting at one-third to one-half the expected service life once a complete 537.1 screen was run.
### GAC operating parameters
- CAPEX: $300 to $600 per m3/day of treated flow - OPEX: $0.10 to $0.35 per m3, with carbon replacement being the dominant variable cost - Carbon service life: 6 to 18 months, depending on PFAS loading and chain length distribution - Breakthrough risk: High without real-time monitoring; monthly lab testing is insufficient - Regeneration: Thermal reactivation is available but transports PFAS to the regeneration facility; off-site disposal costs $0.50 to $1.50 per kg of spent carbon
GAC makes commercial sense as a polishing stage after ion exchange or membrane treatment, where it handles residual organics and extends the life of the upstream train. As a standalone PFAS barrier at a site facing 2024 MCLs, it is adequate only for long-chain-dominant profiles below 200 ppt feed concentration.
[cta:providers]
## Ion exchange resin: the compliance-grade solution
PFAS-selective ion exchange (IX) resin is the technology that has shifted from research curiosity to mainstream deployment most rapidly over the past four years. Single-use and regenerable PFAS-selective resins achieve 95 to 99%+ removal across both long-chain and short-chain PFAS, including GenX and PFBS, which GAC cannot reliably capture. For sites facing strict 4 to 10 ppt MCLs with a mixed PFAS profile, IX resin is typically the most defensible single-technology selection.
The mechanism is electrostatic: the PFAS molecule's negatively charged head group binds to positively charged sites on the resin bead. PFAS-specific resins are engineered with the correct pore size and charge density to preferentially capture PFAS over the competing anions (sulfate, nitrate, chloride) that would rapidly exhaust a standard anion exchange resin. Selectivity is the key differentiator, and it varies significantly between resin products. A procurement team should demand breakthrough curves for their specific feed water chemistry, not just generic removal data.
### Single-use versus regenerable resin
Single-use PFAS-selective resin (sometimes called "disposable" or "one-time-use" resin) is the simpler operational model. When exhausted, the resin is removed and sent for off-site disposal or incineration. No regeneration chemicals, no regenerant waste stream, no complex on-site chemical handling. OPEX is dominated by resin replacement costs, which run $0.20 to $0.45 per m3 at typical loadings.
Regenerable resin systems use a brine or solvent regenerant to strip PFAS from the resin, concentrate it into a smaller-volume regenerant stream, and return the resin to service. The regenerant stream then requires treatment (typically advanced oxidation or thermal destruction) or off-site disposal. OPEX for regenerable systems runs $0.15 to $0.35 per m3 for the resin cycle, plus $0.30 to $0.80 per m3 for regenerant handling. The lifecycle economics favour regenerable resin at high PFAS loadings above 500 ppt, where single-use resin costs become prohibitive.
The resin disposal question is one the industry has not fully resolved. Spent PFAS-loaded resin is a listed hazardous waste in an increasing number of states. Disposal costs have risen from $0.10 to $0.30 per kg in 2020 to $0.50 to $1.50 per kg in 2025 as incineration and disposal capacity tightened. A system life-cycle cost model that was calibrated on 2021 disposal pricing needs to be recalculated.

## Nanofiltration and reverse osmosis for PFAS removal
Membrane-based PFAS removal via [nanofiltration](/nanofiltration) and [reverse osmosis systems](/reverse-osmosis-systems) operates on a different principle from adsorption-based technologies. Rather than capturing PFAS on a sorbent, tight membranes physically exclude PFAS molecules based on molecular weight cutoff and charge. The result is a PFAS-lean permeate and a PFAS-concentrated reject stream (concentrate), which must be managed separately.
Reverse osmosis membranes (nominal pore size 0.1 to 1 nm, molecular weight cutoff below 200 Da) achieve 95 to 99.9% PFAS removal across all chain lengths at typical operating pressures of 5 to 15 bar for surface water feeds. They are effective against GenX, PFBS, and other short-chain compounds that defeat GAC and even some IX resins. The trade-off is energy intensity, typically 0.5 to 1.5 kWh/m3 for the membrane block alone, plus a reject volume of 15 to 25% of feed flow that contains four to ten times the inlet PFAS concentration.
Nanofiltration membranes (molecular weight cutoff 200 to 1,000 Da) sit between ultrafiltration and RO. For PFAS removal, the effective cutoff depends critically on membrane selection; NF membranes with an MWCO below 200 Da achieve 85 to 98% PFAS removal at 2 to 5 bar operating pressure, with lower energy demand than RO. NF is particularly attractive for [industrial water filtration](/industrial-water-filtration) applications where moderate hardness reduction is also required, since the NF pass-through can be tuned to retain useful mineral content while rejecting PFAS.
### When membranes are the right choice
Membranes are the preferred route when:
- Feed concentration exceeds 5,000 ppt (where GAC and IX cycle costs become prohibitive) - The PFAS profile is dominated by short-chain compounds that defeat GAC - The site also needs to address TDS, hardness, or other contaminants in the same treatment step - A zero-liquid-discharge or near-ZLD approach is required
The CAPEX for NF systems runs $800 to $1,800 per m3/day; for RO, $1,200 to $3,000 per m3/day. These figures exclude the concentrate management infrastructure, which frequently adds 20 to 40% to the installed cost and which vendor quotes often omit entirely.
A pattern that recurs in industrial installations: the procurement process evaluates membrane systems on permeate quality and per-unit CAPEX, the contract is signed, and the concentrate handling question surfaces six months later during commissioning. At that point the site is committed to a technology and negotiating from a position of zero leverage on the concentrate management contract. Specify concentrate handling in the original RFP.
[cta:nepti-dark]
## Advanced oxidation and destruction technologies
Advanced oxidation processes (AOP) and electrochemical advanced oxidation processes (EAOP) represent the only technology class that actually destroys the C-F bond rather than concentrating PFAS into a secondary waste stream. That distinction matters in jurisdictions where PFAS-laden concentrates, spent resin, and spent carbon face increasingly restrictive and expensive disposal routes.
Proven destruction pathways include:
- Sonochemical treatment: High-intensity ultrasound generates localized pyrolysis zones that cleave C-F bonds. Achieves 90 to 99% PFAS destruction at lab to pilot scale but remains energy-intensive at $1.50 to $4.00 per m3 of treated concentrate. - Electrochemical oxidation: Boron-doped diamond (BDD) electrodes generate hydroxyl radicals that defluorinate PFAS at the anode surface. Commercial systems demonstrate 90 to 99% mineralisation at OPEX of $0.80 to $2.50 per m3. Best suited to concentrated PFAS streams (above 1,000 ppt) rather than dilute bulk-flow treatment. - Supercritical water oxidation (SCWO): Oxidizes organic compounds, including PFAS, at temperatures above 374°C and pressures above 221 bar. Destruction efficiency exceeds 99.99% but CAPEX is $2,000 to $6,000 per m3/day and the technology is currently more practical as a centralized treatment service than an on-site system. - Thermal treatment: High-temperature incineration (above 1,100°C) destroys PFAS reliably but requires permitted incinerator capacity and generates hydrogen fluoride gas that must be scrubbed. Cost: $1,500 to $3,500 per tonne of PFAS-laden material.
For most industrial sites, AOP and electrochemical destruction make most sense as a concentrate polishing step downstream of a membrane or IX system, not as a primary treatment technology for bulk flow. The economics flip when concentrate disposal costs escalate to the point where on-site destruction is cheaper than transport and third-party disposal, which is already the case in several U.S. states.
The [European Environment Agency's PFAS monitoring framework](dofollow:https://www.eea.europa.eu/en/topics/in-depth/chemicals/pfas-forever-chemicals) identifies destruction as the long-term policy priority over containment and transfer, a signal that regulatory pressure on concentrate disposal will increase. Sites investing in destruction capability now are buying optionality against that tightening.
## CAPEX and OPEX: what PFAS removal actually costs
The honest CAPEX and OPEX picture for PFAS removal is substantially higher than most vendor quotations suggest, because most quotations exclude concentrate management, monitoring infrastructure, and the regulatory compliance overhead of ongoing reporting. The figures below are system-level, meaning they include all the pieces a facility needs to actually operate in compliance.
### CAPEX ranges (all-in, installed, USD)
| Technology | CAPEX ($/m3/day) | Typical installed cost, 1,000 m3/day site | Includes | |---|---|---|---| | GAC primary | $300 to $600 | $300K to $600K | Vessels, media, backwash | | IX resin (single-use) | $500 to $1,200 | $500K to $1.2M | Vessels, lead-lag train | | IX resin (regenerable) | $800 to $1,800 | $800K to $1.8M | Plus regenerant tank, storage | | Nanofiltration | $800 to $1,800 | $800K to $1.8M | Membrane skid, CIP | | Reverse osmosis | $1,200 to $3,000 | $1.2M to $3.0M | Includes pre-treatment | | AOP (concentrate only) | $2,000 to $6,000 | Add-on to above | Electrodes, power supply |
The CAPEX figures above include installed equipment, civil works, and commissioning but exclude ongoing monitoring infrastructure, staff training, and the permit applications required for concentrate disposal routes. For a greenfield site, add 15 to 25% to the equipment cost for site integration. For a retrofit into existing [industrial wastewater treatment](/industrial-wastewater-treatment) infrastructure, integration costs depend heavily on the existing tank farm and piping layout.
Payback on CAPEX is not the right financial metric for a regulatory-driven investment. Compliance is not optional, so the relevant comparison is technology A total-lifecycle-cost versus technology B total-lifecycle-cost at the required compliance threshold, not against the counterfactual of doing nothing. The counterfactual of doing nothing is an enforcement action, litigation exposure, and a forced retrofit under regulatory order, which consistently costs two to four times the planned capital investment.
A pattern that recurs across U.S. industrial sites facing PFAS MCL compliance: the sites that invested in accurate characterisation and right-sized treatment in 2022 to 2023 are operating at planned OPEX. The sites that delayed or selected underpowered technology are now in retrofit mode, at capital costs that have increased 20 to 35% due to materials and labour inflation since 2022.
The OPEX table below breaks down the cost by line item across the four main technology routes. Energy is a minor component for adsorption-based systems and a significant one for membrane systems. Carbon and resin replacement is the dominant variable cost for GAC and IX. Concentrate and residuals management is the hidden cost that most vendor OPEX quotations omit entirely; include it before making any technology comparison.
### OPEX breakdown (USD/m3 treated)
| Cost line | GAC | IX single-use | NF | RO | |---|---|---|---|---| | Energy | $0.02 to $0.05 | $0.02 to $0.05 | $0.10 to $0.20 | $0.12 to $0.30 | | Carbon / resin / membrane | $0.07 to $0.28 | $0.15 to $0.40 | $0.08 to $0.20 | $0.10 to $0.25 | | Concentrate / residuals | $0.01 to $0.02 | $0.05 to $0.15 | $0.06 to $0.20 | $0.10 to $0.30 | | Monitoring and reporting | $0.02 to $0.05 | $0.02 to $0.05 | $0.02 to $0.05 | $0.02 to $0.05 | | Total OPEX | $0.12 to $0.40 | $0.24 to $0.65 | $0.26 to $0.65 | $0.34 to $0.90 |
A 1,000 m3/day industrial facility operating at the midpoint of those OPEX ranges across a 20-year life will spend $900,000 to $6.6 million in cumulative OPEX on PFAS removal alone, before capital amortisation. The spread between the low and high ends is driven almost entirely by the PFAS concentration and chain length profile in the feed water. Which is why the $3,000 to $8,000 investment in a full 537.1 characterisation screen before technology selection is not an optional step. Getting the technology wrong on a 1,000 m3/day site can cost $200,000 to $2 million in stranded CAPEX plus the ongoing OPEX penalty of running the wrong process.
The right answer depends on your feed water chemistry, flow rate, and regulatory envelope. [Post your PFAS removal project](/post-project) and qualified providers will scope the technology options against your actual numbers rather than generic benchmarks.
## Concentrate management: the cost nobody quotes you
Every membrane-based PFAS removal system (NF and RO) generates a concentrate stream that contains the PFAS rejected by the membrane. For a system operating at 80% recovery, 20% of the inlet flow exits as concentrate carrying four to five times the inlet PFAS concentration. On a 1,000 m3/day system treating feed at 1,000 ppt total PFAS, the concentrate stream is 200 m3/day at roughly 5,000 ppt. That is a classified hazardous waste in most jurisdictions.
Concentrate disposal options and their cost ranges:
- Off-site disposal via licensed PFAS waste hauler: $0.50 to $2.00 per m3 of concentrate. For 200 m3/day, that is $100 to $400 per day, or $36,500 to $146,000 per year for this item alone. - Deep well injection: Permitted in some U.S. states for non-drinking-water aquifer zones. Cost: $0.20 to $0.80 per m3 of concentrate but permitting is slow and jurisdictions are tightening. - Evaporation and solidification: Suitable for high-salinity concentrates at arid sites. Reduces volume but does not destroy PFAS. Residual solid is a listed waste. - On-site AOP or electrochemical destruction: $0.80 to $2.50 per m3 of concentrate. Eliminates the transport and disposal liability. Increasingly favoured where disposal fees exceed $1.00 per m3.
The total-cost-of-ownership calculation must include concentrate management from day one. A membrane system that looks competitive at $0.40 per m3 permeate may actually cost $0.55 to $0.70 per m3 once concentrate disposal is fully costed. The correct comparison is not technology A permeate OPEX versus technology B permeate OPEX. It is technology A total system OPEX including all residuals versus technology B total system OPEX including all residuals.
## Where PFAS compliance programs fail
Across [industrial water treatment](/resources/industrial-wastewater-treatment) projects and the publicly available enforcement database, four failure patterns repeat themselves enough to qualify as systemic.
Failure 1: Specifying for 2019 PFAS profiles. Regulatory guidance and enforcement historically focused on PFOA and PFOS. Sites designed their treatment around those two compounds, achieved compliance on the old monitoring schedule, and found themselves out of compliance when the 2024 MCL rule added six additional PFAS and introduced a hazard-index framework. The correct design today must target the full 2024-era compound list, including GenX, PFBS, and PFNA. GAC systems sized for PFOA will fail on GenX without redesign.
Failure 2: Undersized carbon or resin beds. GAC and IX beds are sized on an empty bed contact time (EBCT) that is specific to the PFAS loading. Vendors who quote EBCT from a database average rather than site-specific breakthrough curves routinely undersize beds by 20 to 40%. The result is carbon exhaustion 30 to 50% earlier than projected, with compliance failures on the monitoring schedule. The correct spec is site-specific pilot testing or a performance-guarantee contract, not a modeled projection.
Failure 3: Omitting breakthrough monitoring. Monthly lab analysis of treated effluent is not adequate for a GAC or IX-based system. A carbon bed can break through to non-compliant concentrations in as little as 72 hours after reaching the adsorption front. Online TOC or PFAS-specific sensors are not yet cheap, but the alternative is periodic compliance violations with regulatory consequences that dwarf the monitoring cost. A regulatory penalty in the range of $25,000 to $250,000 per violation per day makes continuous monitoring infrastructure look very affordable.
Failure 4: Ignoring concentrate disposal escalation. Many sites locked in concentrate disposal contracts at 2021 pricing ($0.10 to $0.30 per m3). Those contracts have been repriced at renewal to $0.50 to $1.50 per m3 as disposal capacity tightened. A business case that was positive at the old pricing is frequently negative at current rates. Sites that did not model disposal cost escalation into their 20-year OPEX now face an options problem: absorb the cost, renegotiate, or retrofit on-site destruction capability in a capital-constrained environment.

## Technology selection framework: matching the right treatment to your site
Technology selection for PFAS removal is a four-step process. Skipping any step introduces risk that shows up as either a compliance failure or an overspend on unnecessary treatment capacity.
Step 1: Characterise your PFAS. Commission a full EPA Method 533 or 537.1 screen covering a minimum of 40 PFAS compounds. The screen costs $1,500 to $4,000 per sample. Run it on your raw feed water and on any known contamination hotspot on site. Repeat after any process chemistry changes or new sources come online. This is not optional; it is the foundation that every technology decision stands on.
Step 2: Apply concentration thresholds. - Total PFAS below 200 ppt, long-chain dominant: GAC primary treatment is viable. Monitor weekly for breakthrough. - Total PFAS 200 to 500 ppt, mixed chain length: GAC extended bed or single-use IX resin. Site-specific pilot test recommended. - Total PFAS 500 to 5,000 ppt, any chain length: PFAS-selective IX resin (single-use or regenerable). GAC as downstream polish. - Total PFAS above 5,000 ppt: RO or NF primary treatment with IX or AOP for concentrate. Evaluate on-site destruction. - Short-chain PFAS (C4 to C6) above 10 ppt regardless of total PFAS: GAC alone is insufficient. IX resin or NF/RO required.
Step 3: Model concentrate management. Before selecting a membrane technology, quantify concentrate volume, PFAS concentration in concentrate, and available disposal routes with current (not 2021) pricing. If concentrate disposal cost pushes total OPEX above $0.65 per m3, evaluate whether an IX or hybrid system is cheaper on a total-system basis.
Step 4: Specify monitoring requirements in the RFP. Any PFAS removal technology should be specified with continuous or semi-continuous effluent monitoring as a contract requirement, not an optional add-on. The monitoring specification should reference the effluent MCL and require the supplier to guarantee performance against it under a contractual performance bond.
For sites that operate across multiple facilities or need to compare treatment trains against their actual water matrix, [Nepti](https://www.aguato.com/nepti) models your PFAS source water profile and simulates which treatment configuration minimises lifecycle cost and compliance risk, producing a ranked comparison of technology options with cost projections before you issue an RFP.
Not sure which technology fits your regulatory position? [Browse verified consulting services providers](/consulting-services) who specialise in PFAS compliance engineering, and request proposals scoped to your specific permit requirements.
[cta:post-project]
Before you issue the RFP, compare vetted [industrial water treatment companies](/providers) on Aguato, filter by PFAS removal technology and your permit position, and request scoped proposals so the destruction-versus-separation trade-off above is priced against your specific influent concentrations and discharge limits.
## The CFO Hook
A mid-sized industrial facility with a 1,000 m3/day treatment requirement that correctly specifies PFAS-selective IX resin as primary treatment, based on a $4,000 feed-water characterisation, will spend $700,000 to $1.4 million on CAPEX and $240 to $650 per day in OPEX over a 20-year operating life. A facility that skips the characterisation and installs a GAC system sized for long-chain PFAS only to discover a short-chain-dominated profile faces $200,000 to $600,000 in stranded capital, a compliance gap of six to eighteen months during retrofit, and regulatory penalties that average $37,500 per violation day in U.S. federal enforcement actions. The biggest cost of doing nothing on PFAS is not a fine. It is the liability that attaches once the facility's contamination is linked to a downgradient receptor, which in recent litigation has produced settlement obligations from $5 million to $250 million.
## Related Articles
- [Industrial Wastewater Treatment: Technologies, Costs and Compliance](/resources/industrial-wastewater-treatment) - [Reverse Osmosis Systems: How They Work and Where They Deliver Industrial Value](/resources/reverse-osmosis-systems) - [Industrial Water Filtration: A Procurement Guide to Technologies and Costs](/resources/industrial-water-filtration) - [How to Choose an Industrial Water Treatment Company](/resources/how-to-choose-industrial-water-treatment) - [Zero Liquid Discharge: A Complete Industrial Guide](/resources/zero-liquid-discharge) - [electro-AOP and advanced oxidation processes for PFAS mineralisation](/resources/advanced-oxidation-processes-industrial)
## FAQ
### What is the EPA limit for PFAS in drinking water?
The U.S. EPA finalized its first National Primary Drinking Water Regulation for PFAS in April 2024, setting MCLs of 4 parts per trillion (ppt) for PFOA and PFOS individually, 10 ppt for PFNA, PFHxS, and HFPO-DA (GenX) individually, and a hazard-index limit of 1.0 for mixtures of these five compounds plus PFBS. Large public water systems have until 2029 to comply. Industrial dischargers are subject to effluent guidelines that vary by sector, but the drinking water MCLs are increasingly used as the benchmark in permit negotiations and enforcement actions.
### Which technology removes PFAS most effectively?
PFAS-selective ion exchange resin and reverse osmosis membranes achieve the highest removal rates, 95 to 99.9% across both long-chain and short-chain PFAS compounds including GenX. Granular activated carbon achieves 70 to 90% for long-chain PFAS but performs poorly on short-chain compounds (C4 to C6), which are increasingly prevalent in PFAS-impacted sites. The highest-performing approach for regulatory compliance is typically a PFAS-selective IX resin primary stage followed by a GAC polish, which combines high removal efficiency with operational resilience.
### How much does PFAS removal treatment cost?
For a 1,000 m3/day facility, total installed CAPEX ranges from $300,000 to $600,000 for a GAC primary system up to $1.2 million to $3 million for a full reverse osmosis train. OPEX runs $0.12 to $0.40 per m3 for GAC and $0.34 to $0.90 per m3 for RO, before concentrate disposal costs. A realistic total-system OPEX including concentrate management, monitoring, and reporting is $0.30 to $1.10 per m3 depending on technology selection and PFAS loading. These ranges assume U.S. market pricing in 2024 to 2025.
### Does reverse osmosis remove all PFAS?
Reverse osmosis membranes achieve 95 to 99.9% PFAS removal across both long-chain and short-chain compounds when operating at normal recovery rates of 75 to 85%. The critical caveat is that RO does not destroy PFAS; it concentrates the PFAS load into a reject stream of 15 to 25% of inlet volume. That concentrate, containing four to ten times the inlet PFAS concentration, must be managed separately. If the concentrate disposal pathway is not costed and permitted before the system goes in, the total-system cost frequently exceeds alternative technology options.
### Can GAC alone achieve PFAS compliance under the 2024 EPA MCL?
GAC alone can achieve compliance for sites with long-chain-dominant PFAS profiles (PFOA, PFOS, C8+) at inlet concentrations below 200 ppt, provided beds are properly sized and continuously monitored for breakthrough. It will not reliably achieve 4 ppt MCL compliance for short-chain PFAS or at higher loadings. Sites facing the full 2024 MCL suite, which includes GenX and PFBS, should treat GAC as a polishing step rather than a primary barrier unless the characterisation data confirms a long-chain-only, low-concentration profile.
### How long does PFAS-selective ion exchange resin last?
Single-use PFAS-selective resin service life depends on the PFAS loading in the feed water, not just flow rate. At 100 ppt total PFAS, a properly sized lead-lag IX system can run three to six months per cycle. At 1,000 ppt, that drops to four to eight weeks. Regenerable resin extends effective service life but requires on-site regenerant handling infrastructure and a concentrate management plan for the regenerant stream. Resin cycle life should be modelled against site-specific 537.1 data, not vendor averages, before specifying vessel sizing.
### What are the regulatory requirements for PFAS waste disposal?
Spent PFAS-loaded ion exchange resin and granular activated carbon are classified as hazardous waste in an increasing number of U.S. states and under EPA's 2024 hazardous waste classification proposals. Off-site disposal requires manifested transport to a licensed treatment, storage, and disposal facility (TSDF). Disposal costs have risen from $0.10 to $0.30 per kg in 2020 to $0.50 to $1.50 per kg in 2025. The [American Water Works Association](dofollow:https://www.awwa.org/Resources-Tools/Resource-Topics/Contaminants-of-Concern/PFAS) publishes guidance on PFAS residuals management that procurement teams should reference when evaluating disposal contracts.